Trades with Draft Picks
The first article in this general manager series discussed premium positions, big boards, and approximate value concerning the draft. Trade value charts and player performance metrics were converted into monetary values to compare general manager processes and results.
These trade charts attempt to answer the same question; what is the inherent value of a pick? This becomes important when determining a fair price in trade negotiations. Analyzing trades that involve only picks requires a deep dive into the current cost to trade up. Joseph Hefner’s research delved into how NFL teams value present and future draft picks.
From a breakeven standpoint, the Jimmy Johnson and Rich Hill trade charts are still relevant in how teams value picks in a trade. However, if a team attempts to trade up in the draft, a premium should be attached in theory. For a team to agree to trade down, there must be an incentive beyond a 1:1 value exchange. This incentive compensates the team trading down for the potential opportunity cost of missing out on a highly valued player they might have chosen at their original draft position.
The premium paid can be seen as a risk management strategy, where the team trading up is willing to overpay according to the trade value charts to secure their desired player and mitigate the risk of losing out on him. Richard Thaler and Cade Massey’s research in The Loser’s Curse argues against this justification, suggesting that the value lost makes it not worth it. Michael Lopez’s more recent approach provides some counter-evidence. The majority of the recent studies focus on the average outcome, whereas Lopez looks at right tail outcomes by delving into the probability of hitting on a star player in the draft. Similar to Chase Stuart, Michael Lopez utilizes a player's career Approximate Value (AV) to develop two new draft curves; one for identifying superstars and another that blends the superstar outcomes with the average outcomes.
Both the superstar and blended curves value the first 15 picks in the draft more highly than other trade charts. The superstar curve closely resembles the Rich Hill trade chart after the first round. The blended approach falls between the Fitzgerald-Spielberger trade value chart and the Rich Hill trade chart in the later rounds. It appears that the Fitzgerald-Spielberger chart overvalues mid-round picks in a manner similar to how the Rich Hill chart undervalues them.
Taking a page out of Michael Lopez’s article, a blended approach is used to value picks in a trade. If a pick in a trade is subsequently traded before it is used on a player, the market value (Rich Hill trade chart) is applied. If the pick involved in the trade is exercised by the team that receives it, the player performance value (Fitzgerald-Spielberger trade value chart) is used. Merging these two charts provides a more accurate depiction of the trade market landscape.
The average premium rate for this blended approach is 22.2% for the team moving up using only picks from the current draft. This rate drops to 18.8% when future picks are included. The new method doesn’t discount the value of future picks because teams tend to move future picks at a higher rate than the present picks initially traded for. This could indicate that teams accumulating future picks are more incentivized to use them in trades to move up and get their desired player or move back to stockpile more draft capital. It’s almost as if general managers treat the additional resources as house money.
Looking at the net expected value of trade-ups, the expected win rate for the team trading up from 2016 to 2022 was approximately 32.4%. The net expected value is the difference between the total value sent and received based on the blended approach for picks in a trade. However, the actual win rate for the team moving up was closer to 45.9%. The net value gained, which is based on the Approximate Value (AV) generated over a player’s rookie contract, is used to determine who wins in a trade. The expectation accurately predicted the winner 63% of the time.
Another way to look at it is that, on average, the net expected value for the team trading up was around -$1.4M, whereas the net value gained was around -$0.4M. This means general managers generate more value in trades than the blended approach would anticipate.
When a team trades a draft pick and that pick is traded again before being used to select a player, we use the market rate (Rich Hill chart) to estimate its value. This makes calculating the value gained (VG) a bit tricky. Since the pick doesn't directly benefit the team that initially received it, we look at the value of the next trade involving that pick (Net EV). We figure out what percentage of the new trade’s value comes from the original pick (EV). Then, we multiply that percentage by the value gained (Net VG) from the new trade to capture the value for the team that originally received the pick.
On average, there is a particular trade scenario that is more beneficial for the team moving up. When there is an even pick swap, the team moving up has won ~74.4% of the time, whereas when it is an uneven swap, the team moving up has won ~39.9% of the time. Out of the 222 trades from 2016 to 2022, only 39 (~18%) were even pick swaps. This helps the team moving up maintain the same number of dart throws, aligning with Eric Eager’s Draft Proverbs: “If you are going to trade up, make it for a quarterback, but if it is for another premium position, make it a pick swap.”
Trading up for premium positions (QB, WR, OT, ED, & IDL) is generally a good rule of thumb, though it varies depending on the round and position. Front offices do extensive homework to prepare for the NFL draft. Each team's big board is different, tailored to scheme fit and team needs. Trading up in the first round for edge rushers, wide receivers, offensive tackles, and cornerbacks tends to net positive value compared to waiting for the next player at those positions to be taken.
Front offices strive to anticipate when certain players will be drafted. Teams identify trade partners and make moves to secure their target player before another team selects the prospect. While moving up is not always advantageous, it depends on the position and round. An outlier in this pattern is the 4th round, which is negatively skewed for quarterbacks due to a trade in 2016. The Raiders moved up from pick 114 to pick 100 with the Browns to select Connor Cook. The next quarterback taken was Dak Prescott at pick 135.
When future picks are incorporated into a trade, what is their expected value? Smit Bajaj, a 2024 Big Data Bowl finalist, designed a framework to predict a team’s draft slot based on their preseason market odds. In this analysis, a team’s preseason Vig-Adjusted Win Total from Sports Odd History is used as the independent variable in an Ordinary Least Squares (OLS) model to help explain the variance in a team’s draft slot. These anticipated and actual draft slots are then converted to monetary values based on the Fitzgerald-Spielberger trade value chart. With a Pearson’s R of 0.96, this approach reliably predicts trades involving future picks.
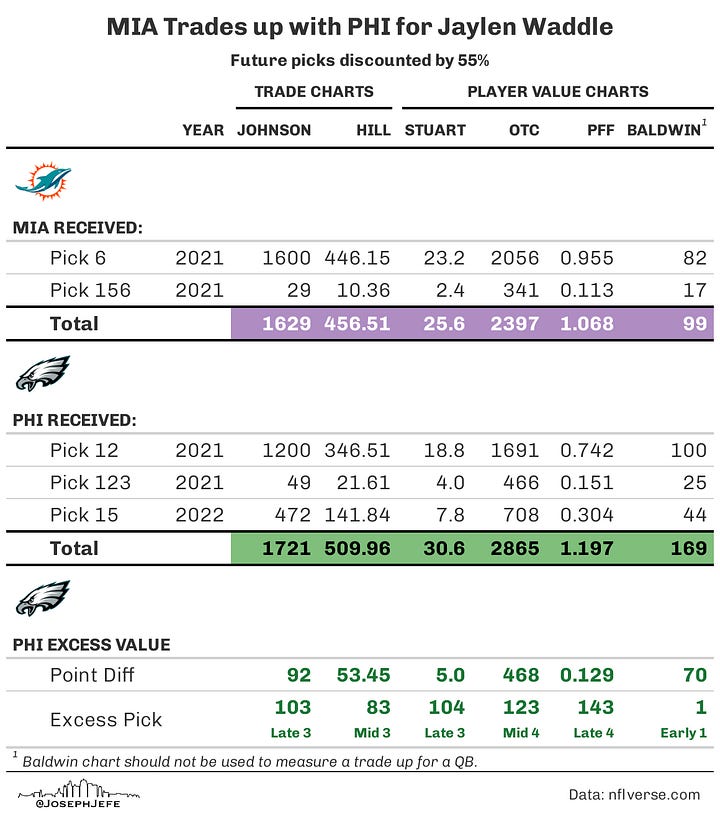
An example that illustrates this future draft slot projection begins with a trade in the 2023 NFL draft. The Cardinals had the 3rd overall pick and initially traded back with the Texans to 12th before moving up with the Lions to 6th. Rewind to the 2021 NFL draft: the Dolphins initially moved back from 3rd to 12th with the 49ers and then back up to 6th with the Eagles.
Considering a 55% discount rate (going market rate), Howie Roseman gained a late Day 2 pick in the trade down from 6th, whereas Brad Holmes gained an early Day 3 pick—roughly a round difference in the trade compensation between the two.


The Eagles and Lions’ trade partners went into those respective offseasons with the 3rd overall pick. The Dolphins, unlike the Cardinals, had just gone 10-6 in 2020 and received the rights for that pick in a trade a couple of years prior with the Texans for Laremy Tunsil. The likelihood of their 2022 pick falling in the middle of the round (picks 11 through 21) was ~46% based on the simulations. The Dolphins' first pick ended up becoming the 15th overall pick.
The Cardinals had a ~40% probability of picking in the top 10 again, according to Vegas, and ended up with the 4th overall selection. The NFL trade market discounts future picks by a full round, so it wouldn’t have been completely unreasonable for Brad Holmes to try to negotiate for a future 1st instead of a present 2nd (34th overall; Sam LaPorta). Fast forward a year later, the Cardinals used the 4th overall pick to select Marvin Harrison Jr.
Time will tell, but Harrison will probably be more valuable than LaPorta regarding their draft slot and positional value. In Holmes' defense, the Cardinals’ future first could’ve been off the table during negotiations. However, receiving less value than the Eagles did two years prior for the same pick shows there was meat left on the bone. This is a great example of how Howie Roseman capitalizes on market inefficiencies when accumulating future draft capital.
Trades with Players Involved
Historically, capturing the value of veteran players and draft picks in a trade is not as straightforward as comparing trades exclusively involving picks. Roster turnover creates an interesting conundrum when evaluating veteran players that are traded for. According to Jason Fitzgerald at Over the Cap, “On average, only 56% of players return from one year to the next, and two years out it is just around 35%.” With this in mind, a veteran’s performance two years prior to being traded and two years after is the time frame used for evaluating trade outcomes.
Approximate Value from Pro Football Reference is used to determine player performance. The Pearson’s R between prior performance and future performance is 0.60, indicating a fairly strong correlation. However, when factoring in player contracts, predicting a veteran’s surplus is tackled with a Linear Mixed Effects model.
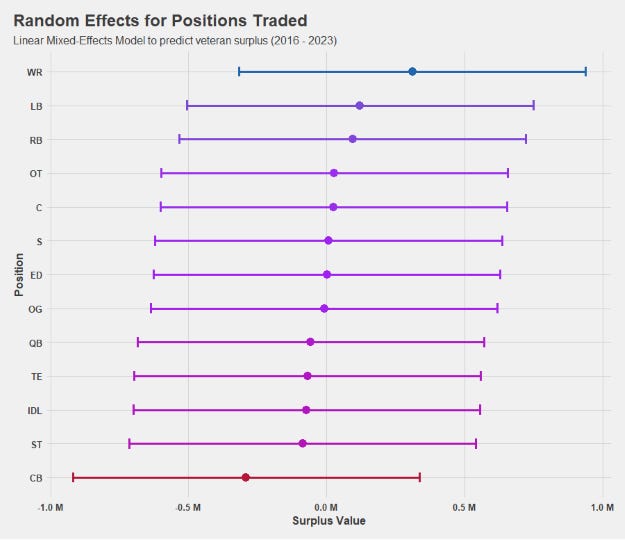
The prior value provided, the player’s age, base salary, and position are used to explain the variance in a veteran’s future surplus. The R-squared for this model is 17%, and all three of the independent variables (fixed effects) are statistically significant. The random effects in this model center around the position traded.
On average, the positions that provide the most surplus are wide receivers, linebackers, and running backs. The positions that provide the least amount of surplus are cornerbacks, tight ends, and special team players.
The reliability of this model is highlighted in the visual below. If prior surplus is used to predict future surplus, there is a Pearson’s R of 0.14 (weak correlation). If the model’s output is used to predict future surplus, that Pearson’s R jumps to 0.43 (fair correlation). While it is by no means perfect, this model provides a reasonable expectation for the surplus provided by players that are traded.
The expected value a player is anticipated to provide a team in a trade is the sum of the predicted surplus and the observed cap hit. The actual value is simply the Approximate Value (AV) produced by the player, converted to dollars. This offseason, several notable wide receivers and edge rushers were traded. Who should be expected to have the biggest impact on their new team heading into 2024?
Brian Burns, L’Jarius Sneed, Jerry Jeudy, and Joe Mixon all received new extensions. Stefon Diggs’ contract was restructured and Haason Reddick has requested a new deal. It’s not uncommon with blockbuster trades in the offseason to result in a raise. With draft pick and veteran player value appropriately accounted for, these metrics can be applied to a few case studies and look at the overarching implication for general managers.
Case Studies
Cade Massey stated on The Meb Faber Show, “the first pick is the most valuable pick in the draft, but only if you don't use it.” The first overall pick has only been traded twice over the past decade. In both cases, the team moving down scored a massive haul.
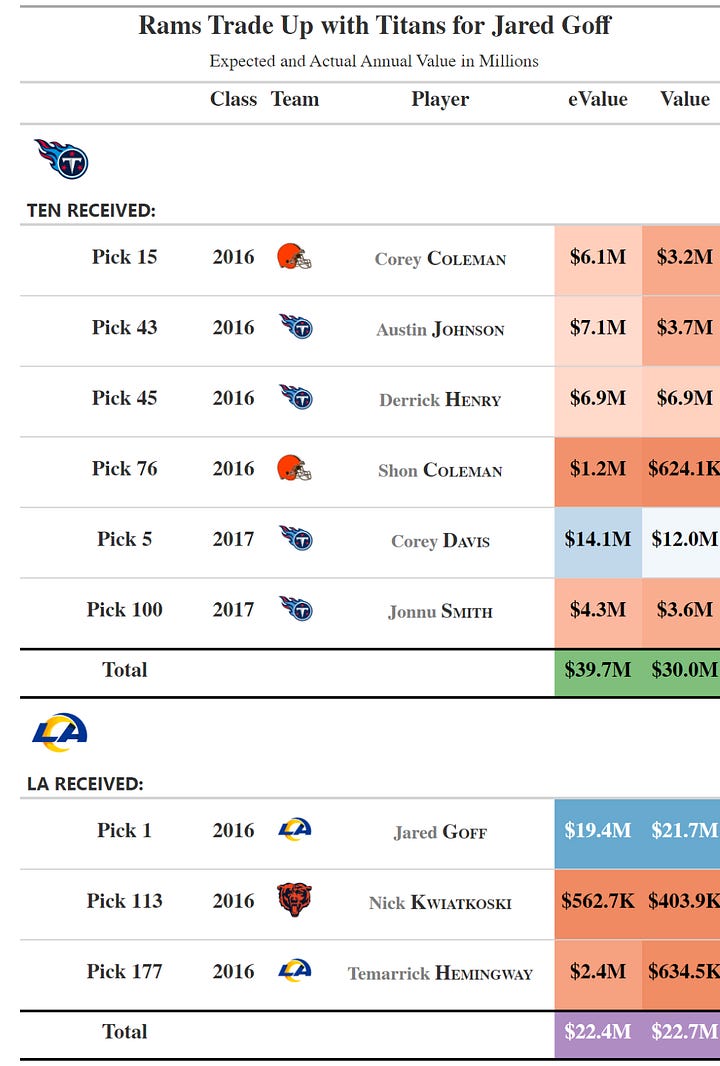
In 2016, the Rams traded with the Titans to move up and select Jared Goff. The annual value the Rams were expected to receive was $22.4M, and they ended up getting $22.7M in value. The Titans' haul was expected to provide $40M annually in value, but their return was $30M. While the Rams maximized Goff’s rookie contract with a Super Bowl appearance in 2018, the Titans still won this trade by around $7M in net value.


The more recent trade-up to the first overall pick was in 2023. The Panthers moved up with the Bears to select Bryce Young. If Caleb Williams and the Panthers' future 2nd in 2025 net the Bears the expected $25M in annual value, they will have more than doubled the value the Panthers received. The question comes down to whether it was worth it to move all the way up to the first overall pick. Teams like the Chiefs, Bills, and Ravens got their franchise quarterback by trading up in the first round without sacrificing as many assets as the Rams and Panthers did in these scenarios.
Are there other avenues to finding a franchise quarterback outside of the draft? The Rams, two years after extending Jared Goff, found themselves in a situation where the team wanted to go in another direction at quarterback. A little over a year prior, Les Snead had just traded two firsts (2020 & 2021) for Jalen Ramsey. He doubled down in the Spring of 2021, sending Jared Goff, two future firsts (2022 & 2023), and a third-round pick for Matthew Stafford. Less than a year later, the Rams were hoisting the Lombardi trophy.


The NFL is a copycat league, and sure enough, a couple of teams that felt they were a quarterback away from making a Super Bowl run went out and tried to trade for one to put them over the top. Unfortunately, the Wilson and Watson trades didn’t pan out as intended for the Broncos and Browns. The Broncos cut Wilson this past spring, incurring a dead cap hit of $85M over the next two seasons while the Browns aren’t in a position to part ways with Watson due to his fully guaranteed contract and will retain him as the starter heading into 2024.
The Seahawks and Texans have been able to use this trade capital to rebuild their own rosters. The Seahawks added several starters on both sides of the ball, while the Texans used the draft capital to move up and select Will Anderson and trade for Stefon Diggs. This isn’t the first time we’ve seen Stefon Diggs get traded. In 2020, the Bills acquired Diggs from the Vikings for a first-round pick along with a few day-three picks. This trade was a win-win for both sides. Josh Allen developed into the superstar quarterback he is today because of the acquisition of Diggs, while the Vikings drafted arguably the best wide receiver in the NFL right now.


The Eagles saw the impact that a WR1 could have on a young quarterback’s development going into year three and traded for AJ Brown for a first and third-round pick. That year, Jalen Hurts and the Eagles went to the Super Bowl. Unlike the Vikings, the Titans didn’t find a suitable replacement for AJ Brown with the selection of Treylon Burks, who is fighting for a roster spot this offseason.
While trading for quarterbacks doesn’t always pan out, acquiring young, talented wide receivers via trade has a proven track record. For teams in need of wide receivers with quarterbacks on rookie contracts, it should be a no-brainer to send a first-round pick or a trade package of similar value to acquire players like Brandon Aiyuk or CeeDee Lamb if either becomes available.
Putting It All Together
Quarterbacks are the most valuable position on the field, and the market value far exceeds that of any other position. Because of this trading for QBs typically comes at a higher cost. The Net Expected Value and Net Value Gained for general managers highlight some intriguing narratives. Notably, two of the five active general managers with two or more Super Bowl appearances since 2016, Les Snead and Howie Roseman, are found in the bottom left quadrant for both non-QB and QB trades. Despite this, both have won Super Bowl rings in this period. What gives? How can teams that lose so much value via trades still make it to multiple Super Bowls and win the Lombardi trophy?
The answer lies in their aggressive approach to acquiring and building around quarterbacks. Both general managers initially invested heavily in drafting a QB (Goff for the Rams and Wentz for the Eagles), extended those QBs, and then took further losses when offloading them after regretting the big-money contracts.
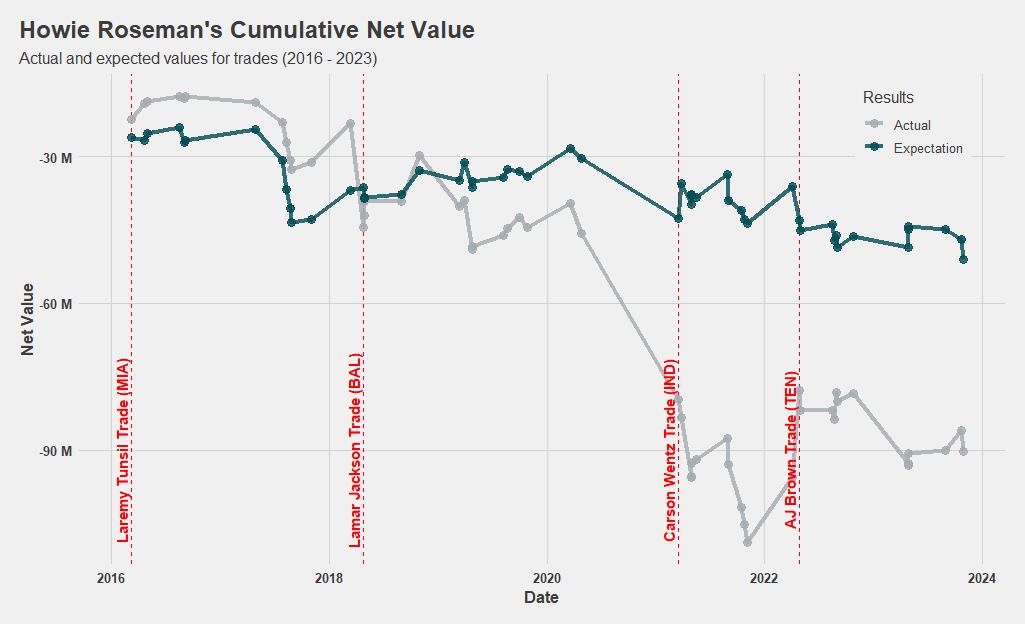
For the Eagles, the journey began in 2016 when they traded up from pick 13 to pick 8 with the Dolphins and then moved up to pick 2 with the Browns to draft Carson Wentz. They gave up Kiko Alonso, Byron Maxwell, and pick 13, which turned into Laremy Tunsil—a significant loss despite winning the trade up for Wentz with the Browns.
In the 2018 draft, fresh off their first Super Bowl victory, the Eagles traded out of the first round with the Ravens, who selected Lamar Jackson. The significance of this move isn't just that Lamar is now a two-time MVP; it’s that the Eagles would end up drafting Wentz’s replacement, Jalen Hurts, two years later. What if the Eagles had drafted Lamar and let him develop behind Wentz who was coming off an ACL injury?
When the Colts traded a conditional first-round pick for Wentz in 2021, it seemed like a steal. Wentz provided above-average play, but the Colts then traded him to the Commanders the following offseason. The Eagles turned the Colts’ first-round pick in 2022 into a mega trade, sending picks 16 and 19 to the Saints for pick 18 in 2022, a first-rounder in 2023, and a second-rounder in 2024. They then traded pick 18 to the Titans for AJ Brown.
This approach emphasizes a 2-4 year competitive window over long-term roster building. The analysis considers salary cap hits in the first two years after a veteran player is traded, not accounting for backloaded contracts or future dead cap hits. It also doesn’t factor in a team's ability to retain players they draft or trade for. While the Colts didn’t find a long-term QB solution in Wentz, the Eagles restructured their roster around Jalen Hurts' rookie contract. Despite incurring over $30M in dead cap from trading Wentz, Howie Roseman managed to recoup value from a bad situation by having a young quarterback ready to step in.
Should teams consider adopting a 1A and 1B approach at QB sooner rather than later? The Packers have demonstrated a seamless transition from Favre to Rodgers and now from Rodgers to Love over the past three decades, utilizing a similar method. However, we’ve also seen this methodology backfire for the 49ers, who traded significant resources to draft Trey Lance 3rd overall and have him sit behind Jimmy Garoppolo, only for Mr. Irrelevant (Purdy) to take the starting job. It's not a foolproof method, but it’s a strategy that has worked for several teams including the Chiefs (Mahomes), Ravens (Lamar), Eagles (Hurts), and Packers (Love) over the past decade.
A team attempting to mirror this approach are the Falcons. Terry Fontenot signed Kirk Cousins in free agency and drafted Michael Penix Jr. 8th overall this offseason. While the Cousins signing was lauded by many, several people viewed Penix as a massive reach. If Penix develops into the franchise QB, this will be seen as a phenomenal move. If he doesn’t, it will have been a valuable pick that could have been used on a more immediate impact player.
Special Thanks To…
This project would not have been possible without my co-author, Colin Dunphy, who spent countless hours refining the theory that laid the bedrock for this article. Tej Seth and Daniel Salib helped further improve the results with invaluable insights along the way.
The prior research of Cade Massey, Richard Thaler, Jason Fitzgerald, Brad Spielberger, Michael Lopez, Joseph Hefner, and Smit Bajaj were also instrumental to the findings presented in this article.


