
Pressure Points: The Balancing Act
A few thoughts on pocket management

A recent tweet charting unblocked pressure and hit rates within 2.5 seconds sparked both thoughtful discourse and immediate pushback. At the center of the conversation was Joe Burrow, whose pocket management remains a point of contention.

For the record, I’m aware that pocket management extends beyond just those parameters. The intent was to highlight pass rushers with the fewest obstacles to the QB. In other words, players who take the shortest path from A to B. While this captured the pressures on the right side of the bell curve, it didn’t represent all of the ones that occurred within 2.5 seconds.
So what is pocket management? A lot of the discourse revolved around opinions drawn from stats or film, but there is no consensus about what the term means or what it’s composed of. This piece aims to clarify what pocket management entails.
Sacks are a QB Stat
The “nerds” would argue pocket management is captured in metrics like sack rate, pressure to sack ratio and efficiency lost to sacks. While most fans credit sacks to the offensive line, research shows sack rates are more stable year over year for the passer than it is for the blockers.
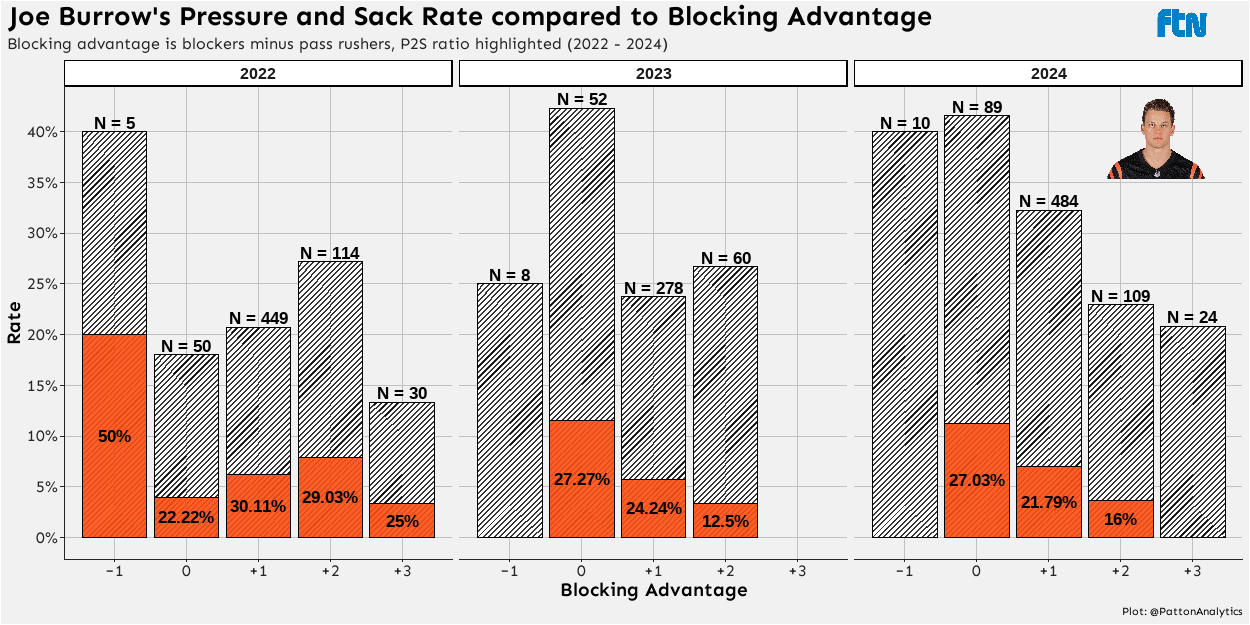
Burrow is a good example. Despite fluctuating pressure rates (20.7% → 23.7% → 32.2%) with a blocking advantage of +1 (typically a standard protection of five down linemen and four pass rushers), his sack rate has remained stable (6.2% → 5.8% → 7%). This suggests sack avoidance is more about the QB than the protection.
He’s improved his ability to mitigate sacks when facing a free rusher (-1) or using extra blockers (+2), but has regressed when the defense sends an extra rusher (0). The initial response would be that his pressure rate with an additional rusher has increased over the past three seasons. Yet, this isn’t just a Bengals specific trend. The NFL has seen a similar increase over the same span. For context, here are the league averages over that same duration:
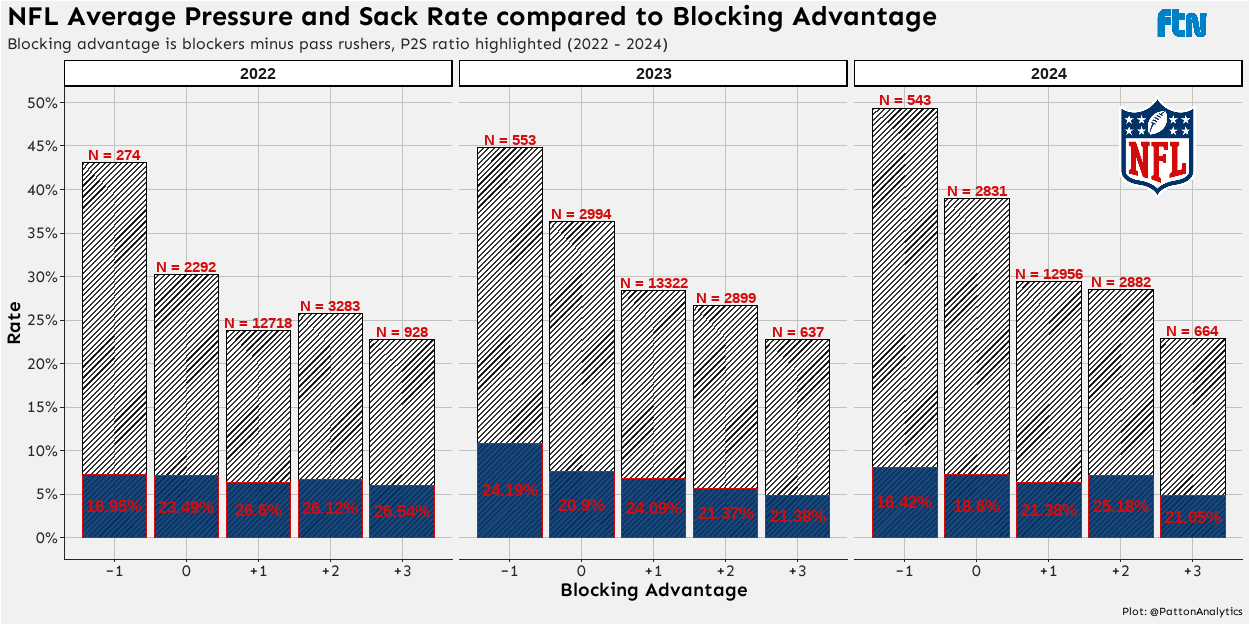
Pressure rate decreasing with extra blockers and sack rates staying relatively the same seems to indicate that pressure is more of a blocking stat and sacks are more a quarterback stat.
Since 2020, Burrow ranks 8th in EPA lost to sacks per game (-5.3) and 17th in EPA lost per sack (-1.9) out of 57 qualifying QBs. For context, the average EPA lost for fumbles is -4.1 and interceptions is -4.4.
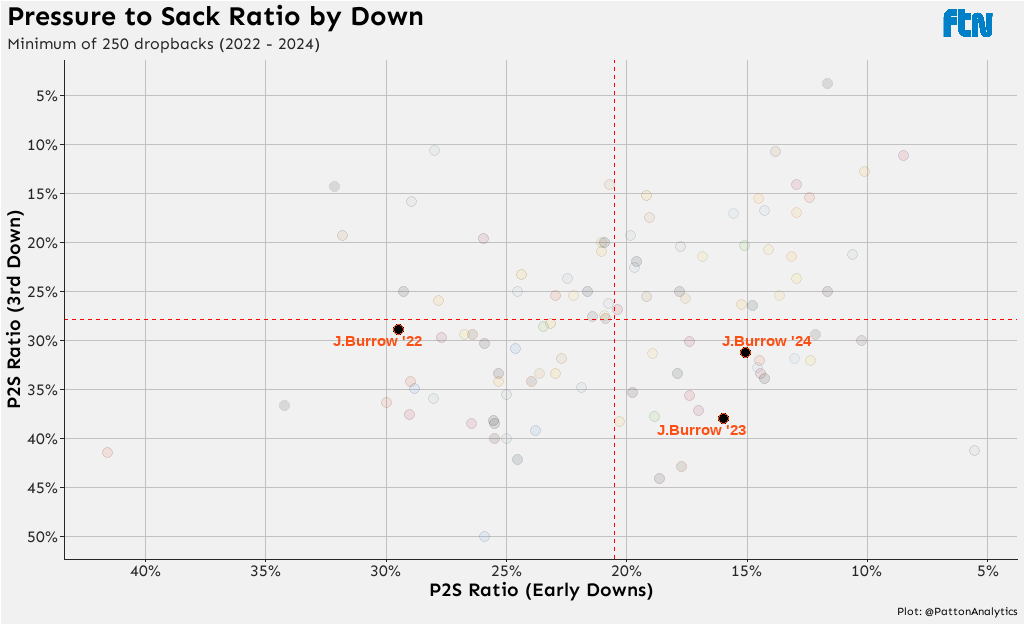
His sack avoidance on earlier downs saw a big improvement over the past couple of seasons. However, his pressure to sack ratio on third downs still lags behind the league average. Taking a sack in third and long situation can be a calculated risk, but those risks add up over the course of a game.
Even when sacks occur on third down, where the drive likely would have stalled with an incompletion, they still carry consequences. Sacks increase the risk of a fumble or, worse, an injury to the QB. At the game’s most important position, availability is everything.
They also play a role in field position. On third down plays where the QB was sacked, opponents began their next drive at their Own 38 on average. When the sack was avoided, that average starting field position shifted to their Own 33.
The Natural Decomposition of the Pocket
The issue with most sack related metrics, regardless of how much blame falls on the QB’s shoulders, is it doesn’t factor in offensive line performance. Not all pockets collapse at the same speed. Using the Kaplan-Meier estimator, we can predict how long a QB typically has before pressure arrives. These survival curves suggest a reasonable expectation for the time to throw falls between two and three seconds.
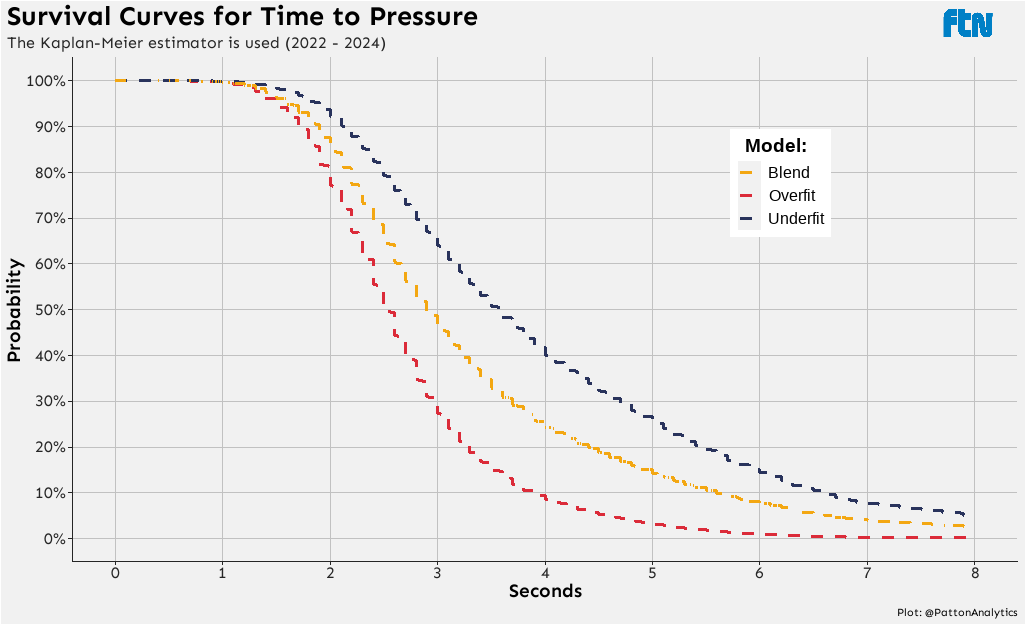
For readers familiar with modelling terminology, this paragraph is for you. When it comes to survival curves it’s always good to keep in mind censoring bias. In the case of the red line (overfitting), it only accounts for plays with pressure whereas the blue line (underfitting) includes all dropbacks and uses time to pass if there was no pressure. Somewhere in between the two is a happy medium for how long the offensive line should expect to hold up. The blended approach is just the average of those curves.
Pass Block Win Rate (PBWR) from ESPN uses 2.5 seconds as the threshold for determining whether a blocker won their rep. For context, 52% of dropbacks end with the ball released within 2.5 seconds, 60% within 2.7 seconds, and 70% by the 3 second mark. The longer a QB holds the ball, the greater the risk of negative outcomes.
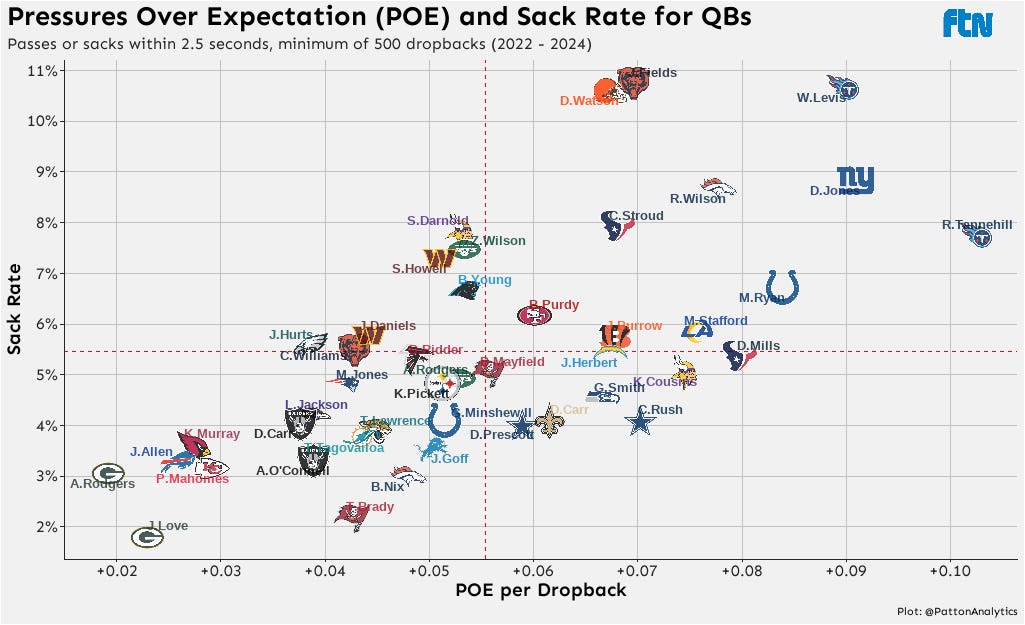
When looking at Pressures Over Expectation (POE) using the blended survival curve within that 2.5 second window, Joe Burrow appears alongside other traditional pocket passers like Kirk Cousins, Justin Herbert, Geno Smith, and Derek Carr, all of whom, interestingly, post lower sack rates.
If pressures are more of an OL stat and sacks are a QB stat, who’s primarily at fault considering the fairly linear relationship between the two? Compounding the issue, the Bengals have allocated more cap space to their offensive line over the past three seasons than teams like the Bills and Packers have.
Not all pressure is created equal, and not all QBs respond to it the same. Let’s take a closer look at how Burrow handles pressure. In a PFF study, Judah Fortgang found that QBs who moved out of the pocket [escapability] were twice as efficient as those whoe stayed in [pocket awareness]. Recent data supports this. QBs who moved out of the pocket generated -0.28 Expected Points Added (EPA) per pressure, whereas QBs who stayed in the pocket averaged -0.57.
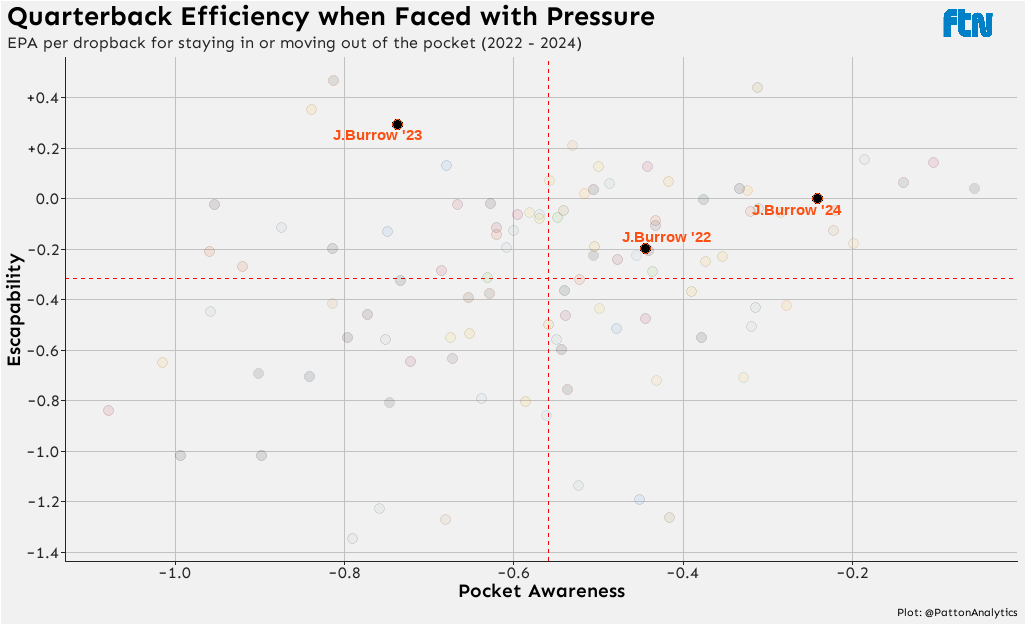
On a per play basis, Burrow’s pocket awareness is really good. However, he stays in the pocket 79% of the time when faced with pressure, which is above league average (~76%). That means in four out of every five pressured dropbacks, Burrow stays in the pocket, leading to plays that are less efficient than moving outside of the pocket.
At a certain point, the pocket stops being a viable workspace. Knowing when to leave it is a great way to mitigate the impact of pressure. This is an element of the modern evolution for QBs. To Burrow’s credit, the rate at which he escapes has increased each year since 2022, reaching 25% this past season.
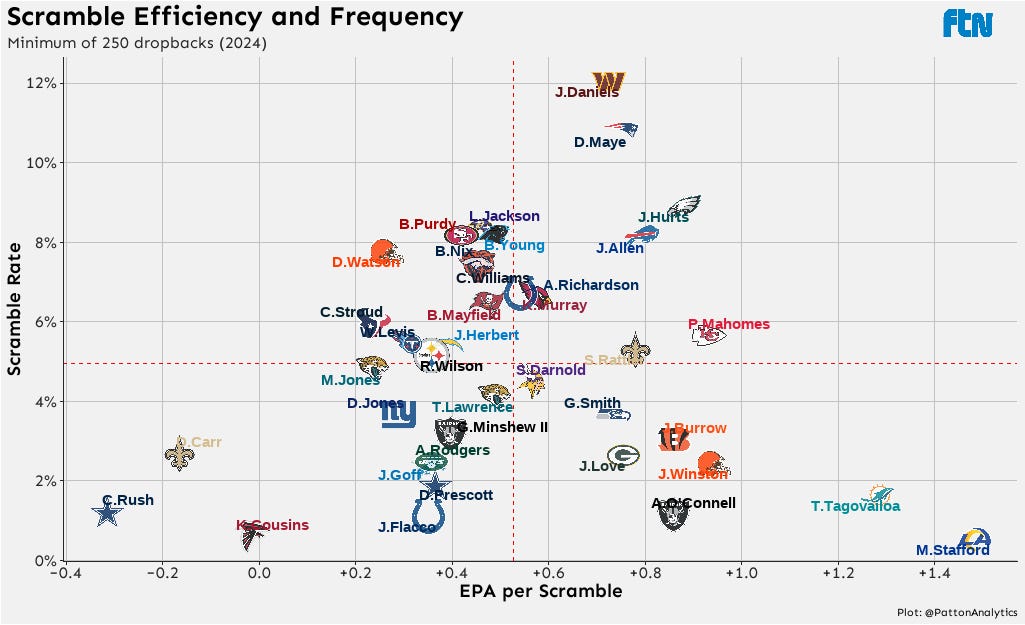
One thing a QB can do when he escapes the crumbling pocket is to scramble. Burrow is efficient when he scrambles, he just doesn’t do it often enough. QBs with similar efficiency and usage this past year either dealt with injuries (Tua Tagovailoa and Jordan Love) or were viewed as backups (Jameis Winston and Aidan O’Connell).
Playing on Hard Mode
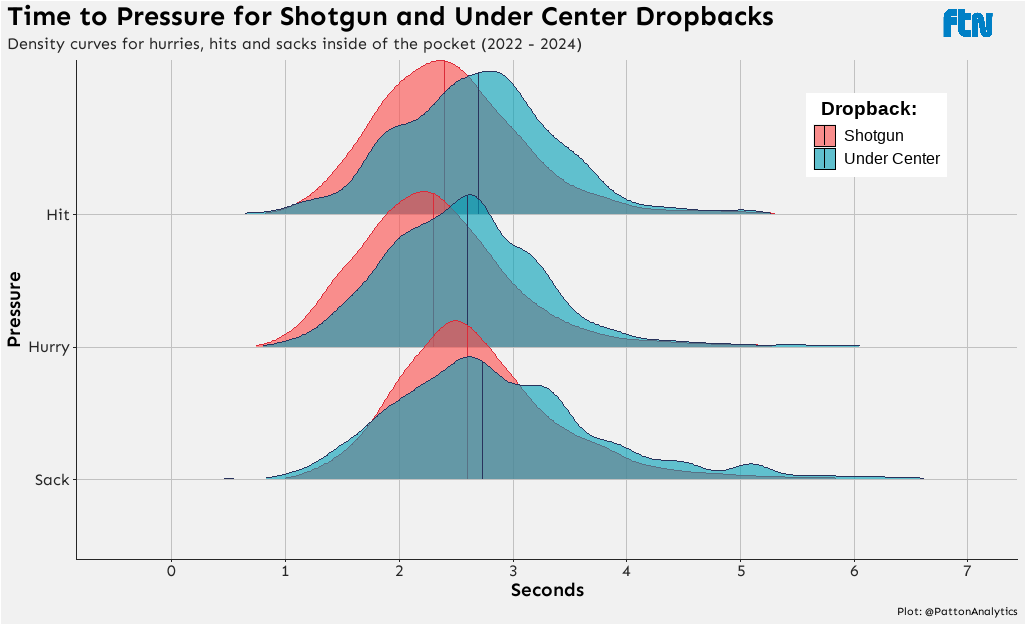
The Bengals’ offense operates almost exclusively out of shotgun, which doesn’t do the offensive line any favors. On average, time to hurries (2.46 → 2.69), hits (2.34 → 2.59), and sacks (2.71 → 2.87) are all quicker from shotgun than under center. A higher usage of shotgun simplifies the offense for defenders and allows pass rushers to tee off against the blockers in front of them.
Among QBs with at least 1,000 snaps since 2022, only seven out of 41 have operated out of shotgun on 80% or more of their plays: Jalen Hurts (89.8%), Joe Burrow (84.3%), Gardner Minshew (84.1%), Sam Howell (81.1%), Lamar Jackson (80.7%), Kyler Murray (80.1%), and Patrick Mahomes (80%). Of that group, Mahomes is the only one with a sack rate under five percent (4.3%) during that span.
When Burrow missed time in 2023, Jake Browning’s drop in shotgun usage (93% → 76%) coincided with a more efficient offense (-0.02 → +0.01 EPA/play). Burrow’s lingering calf injury undoubtedly played a role. Still, the schematic shift itself is worth noting. Shotgun usage isn’t strictly a Zac Taylor staple; it reflects Burrow’s stylistic preference.
Time to pressure also increased from 2.4 seconds with Burrow to 3.2 with Browning. It’s a small sample, but the gap is significant. This raises a legitimate question: is Burrow’s preferred play style capping the ceiling of the Bengals’ offense?
Separating Myth from Reality
Twitter is an echo chamber; same drum, similar beat. The explanations for why Burrow’s sack rate is high were countless but many of them were repetitive. I figured I’d touch on a few of the main ones before signing off.
It’s not just the bad line, it’s specifically the bad interior. It’s hard for a QB to step up in the pocket when the interior of your offensive line is porous. However, that doesn’t change the fact that pressure off of the edge has more negative impacts on the offense than interior pressure. Don’t just take my word for it, this was studied in detail by Eric Eager and George Chahrouri at PFF a few years ago.
Blaming Burrow’s sack issues on interior offensive linemen seems more like recency bias. Their pressure rates ranked 25th (6.2%), 13th (11.9%), and 1st (13.7%) from 2022 to 2024. Prior to last season’s drop off, the interior has been at least serviceable. For comparison, pressure rates from his offensive tackles ranked 16th (10.8%), 16th (13.9%), and 24th (11.1%) over the same span.
He’s facing multiple inescapable pressures on dropbacks. Over the past three seasons here is how frequently he’s seen two or more pressures on a play: 12th (2.3%), 13th (4.1%), and 14th (2.8%). Those numbers are fairly average overall, not the flood gates Bengals fans make them out to be.
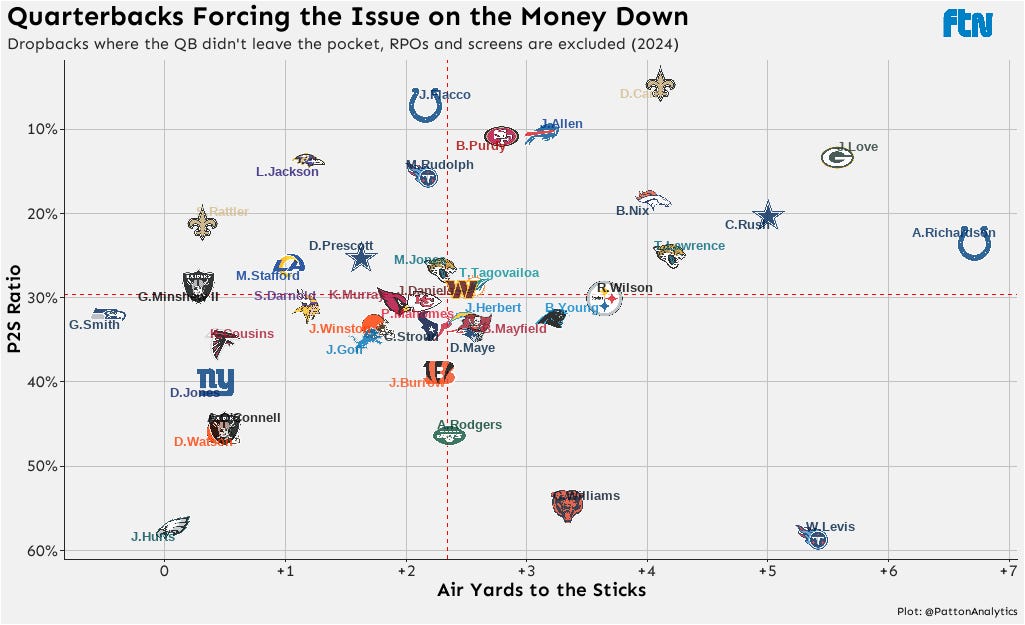
His high sack rate especially on third down is because he’s trying to extend the play to push the ball down field. As the plot from last season shows, he targets beyond the sticks but isn’t necessarily letting it rip.
“Watch the tape and tell me he’s bad at pocket management.” That argument often relies on a handful of memorable plays or curated highlights, hardly enough to draw meaningful conclusions. Burrow ranked top 10 in both sacks avoided and sacks deemed his fault last season. Cherry picking goes both ways.
Joe Burrow doesn’t need to be Lamar Jackson, but in a shotgun heavy scheme behind a shaky line, staying in the pocket at the rate he does will cap the Bengals’ passing ceiling. He needs to sense the pocket collapse sooner and occasionally bail before it’s too late, because when you’re playing on hard mode, the margins for error become razor thin.
Super read, this 👏
Love this.
It would be interesting to zoom into Caleb Williams' numbers.
He gets crucified for poor pocket management.